
Published in Spring 2024
You did it. You designed great training. You delivered an amazing training experience. Then, to your delight and credit, in the months that followed your training, the key business metrics that are most important to your stakeholders actually showed a positive increase. Success! Your training worked! You’re a star! Right?
Not so fast. What about all the other possible factors that could influence employee performance and boost the health metrics of your organization during those same months? Maybe the market opened up. Maybe a new technology came along. Maybe the same employees who took your training also took another training the same month. The bad news is, whatever the post-training increase was, we’ll never be able to take credit for all of it. But the good news is we can take credit for some of it.
So, your next question has to be, how do we calculate that “some”? How do we credibly and confidently attribute a certain percentage of that overall increase in performance to our specific training and grab our slice of the credit? How can we finally step up and boldly shout, “We did that! Our training caused those great business results!”? The answer is that you have to gather the right data to isolate the impact of your training.
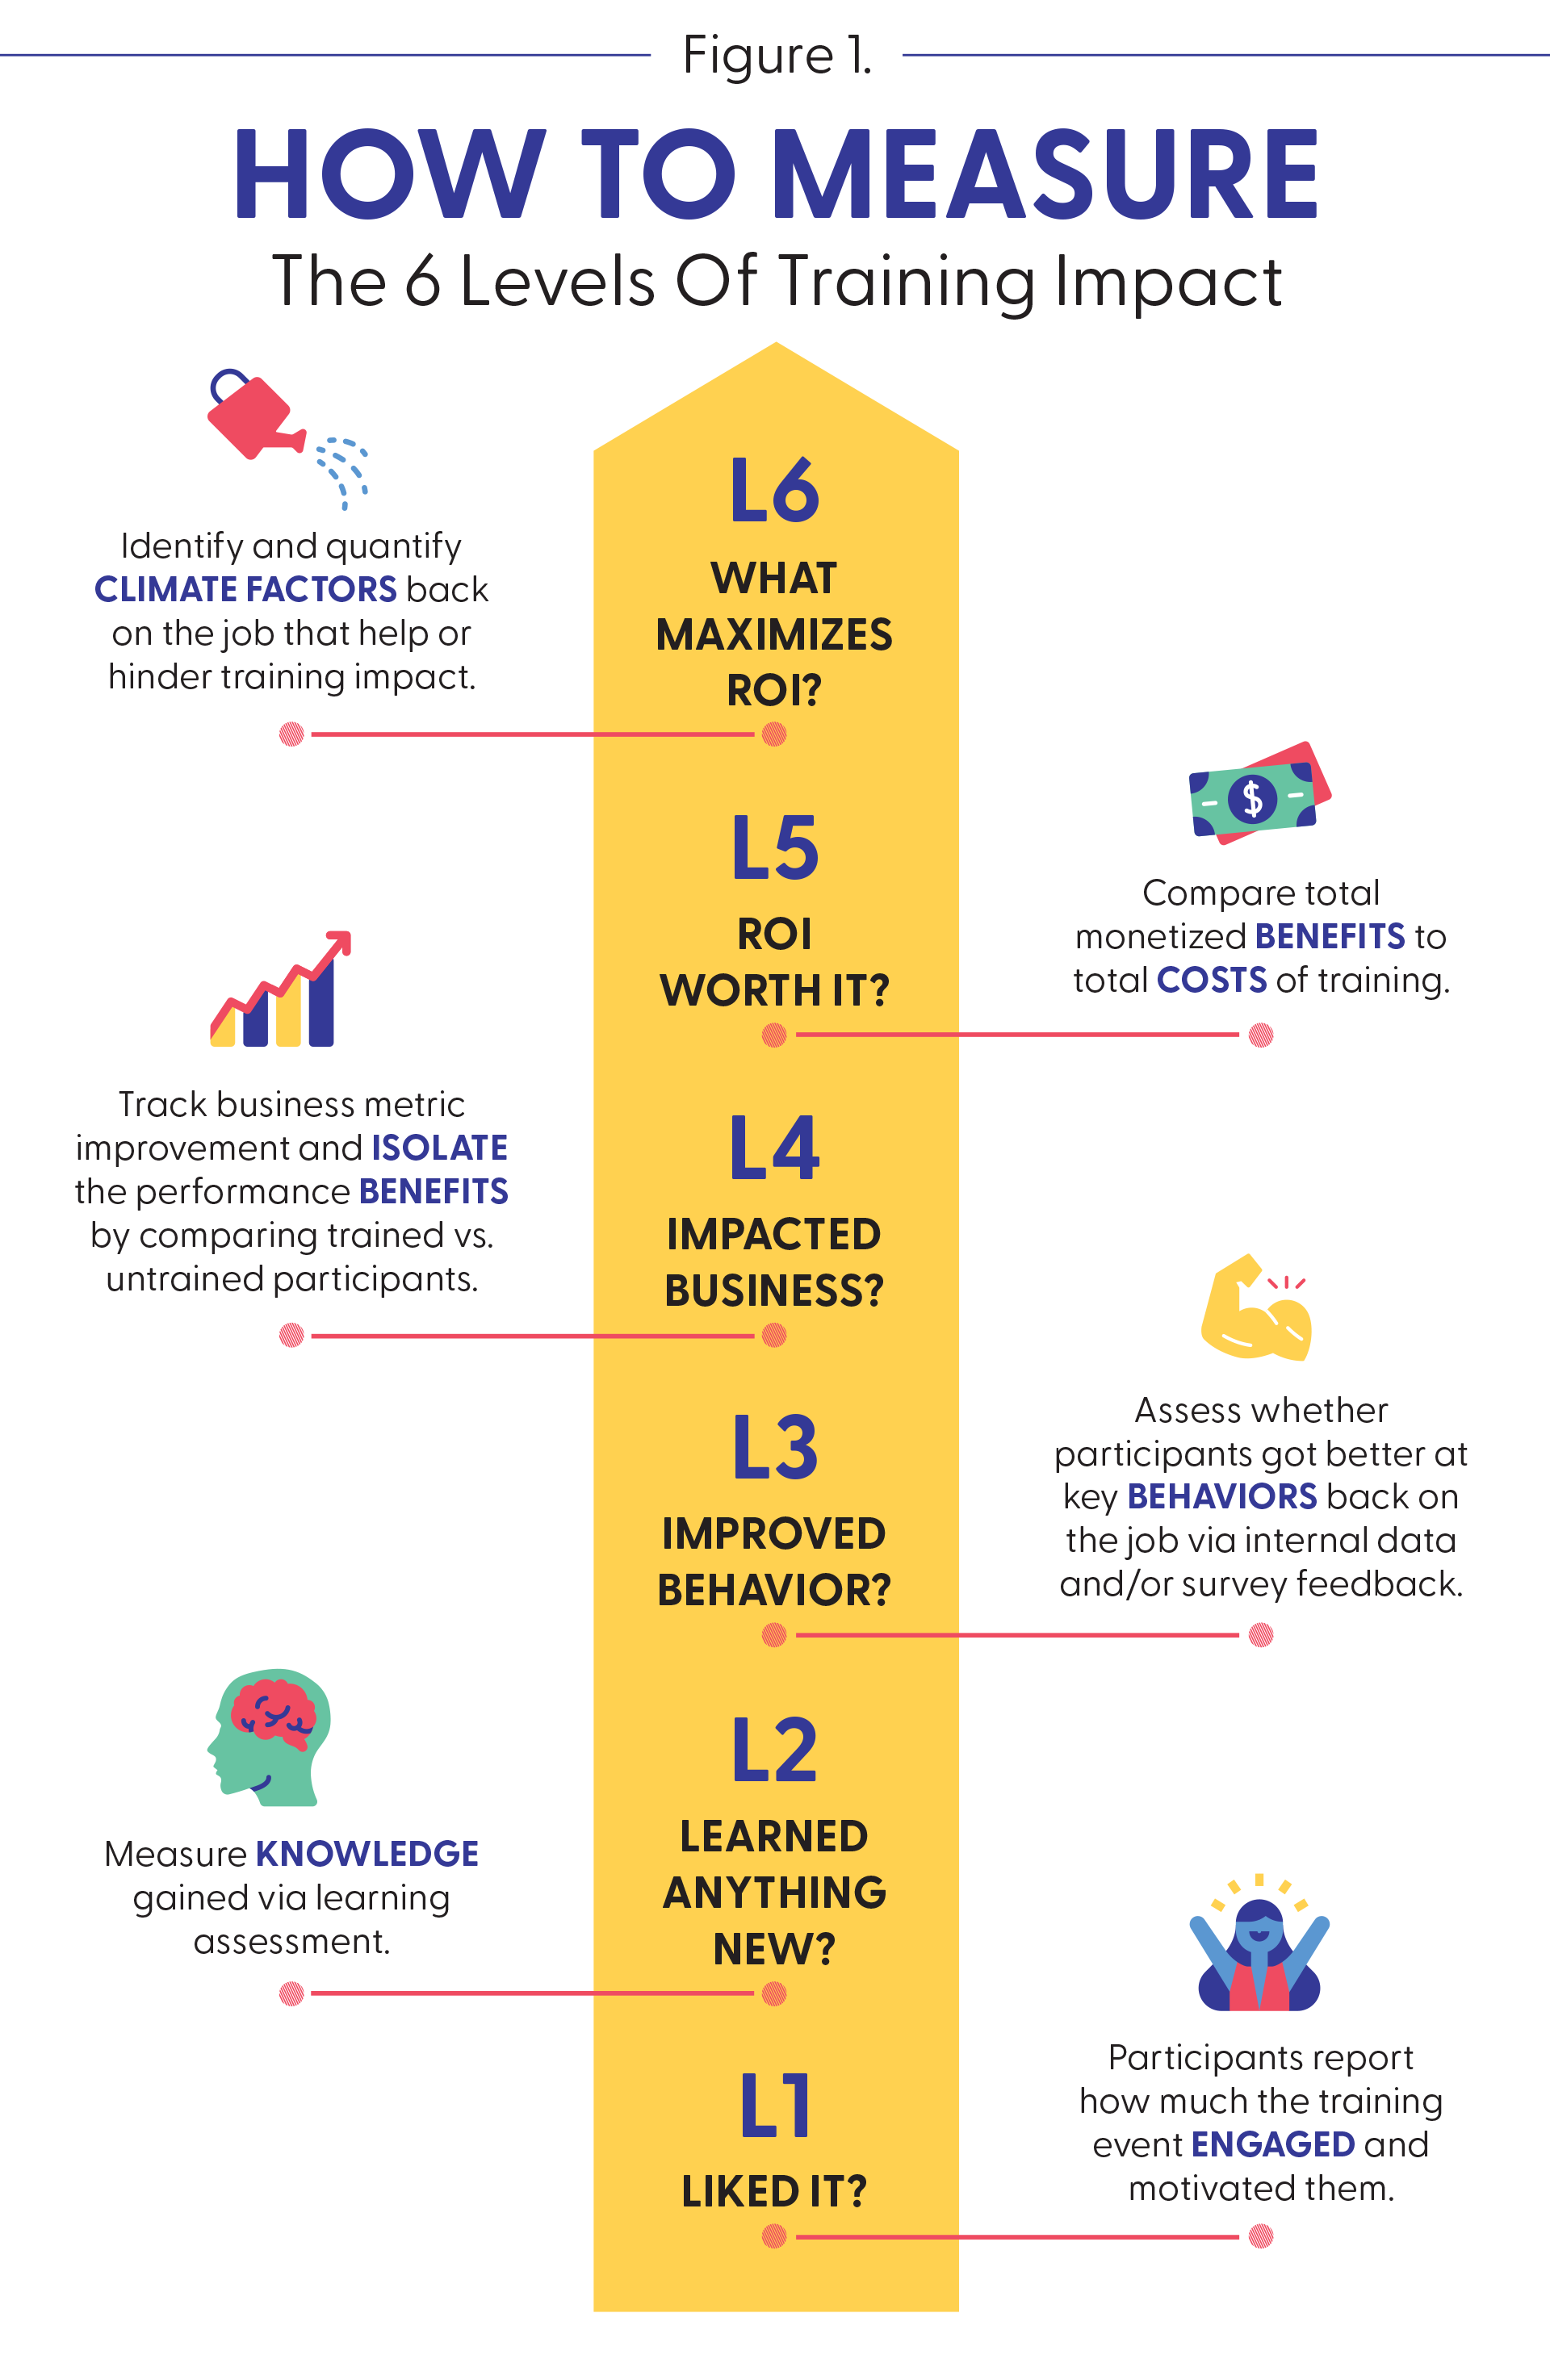
Isolating the impact of your training always happens at Level 4 (see Figure 1). In essence, it cuts away the noise of other possible factors and carves out a percentage of the overall business performance that you can confidently attribute directly to your training. We call it “isolating” because it collects and uses specific data to parse out the effects of other influencers, attempting to leave your training all alone as the one and only influencer of at least a portion of any business improvement.

3 Ways to Isolate
There are three primary techniques you can use to do this. Below is a high-level summary of each approach, some guidance on when to apply each one and finally an example of how it was used in a real-life case study within an organization.
1. The Control Group Technique
The control group (trained vs. untrained) technique compares the improvement of a trained group to the improvement of an untrained “control” group on a particular performance metric over the same time period. Here, it’s critical that these two samples of employees are working under the same market conditions, come from the same business functions, have the same tenure, etc. — with the only difference between them being the training. By controlling for all the other variables that could influence performance, you can confidently claim that any incremental improvements for the trained group above and beyond the control group can be directly attributed to their training experience.
This method was used at Verizon to test the effects of a sales leadership program. Here, a large group of sales leaders (Group A) went through training in the spring and another similar sales cohort (Group B) attended in the fall. This provided the perfect opportunity during the summer months to look for sales improvements of the trained group versus their untrained counterparts. While both groups improved gross revenue and new activations during those summer months, the trained group improved significantly more. We only took credit for the raw differences in improvement between the two groups from the pre- to the post-training months. While this increase was a fraction of the overall improvement, by comparing it to the control group, we isolated the specific and direct effect of the training. This allowed us to carve out a $2,134 benefit for the trained group, leading to a positive return on investment (ROI) of 29% after just three months post-training.
2. The Attribution Technique
The attribution technique is when you find an increase in a performance metric, but don’t have a control group to compare it to. Remember, you still want to take credit for a slice (percentage) of this improvement from the pre- to post-training period, so you ask participants to attribute a portion of that increase to the training. Here, you may ask them “Of all the things that could have improved this performance metric from March to June — how much would you attribute to you applying the training?”
Once you have an average percentage across all participants, you simply multiply that by the increase you find in the objective performance data. For instance, if sales increased by 16%, and your trainees on average said that training was responsible for 25% of that increase, then you could confidently attribute a 4% increase in sales to your training. The key here is that you are not trying to take credit for the entire jump in performance, but rather chopping it down and isolating the impact by having participants consider other factors and only attribute a percentage of their overall performance gains to training.
This method was used at a large cybersecurity tech company to test the effects of a new call center training. The customer care reps were trained on how better to resolve technical issues and avoid transferring customers to more costly tech troubleshooting specialists. Here, the post-training data showed an increase in first call resolutions and a decrease in transfers that led to an overall cost savings of $1,829 per call rep. When we asked how much the training contributed to this reduction in transfers, the average reported was 48%. We then multiplied the $1,829 cost saved by 48% and got a final benefit of $878 per participant, yielding an ROI for the company of 110%.
3. The Estimate Technique
The estimate technique is used when we can’t get a control group and we can’t get any actual participant performance data from human resources (HR) or the business to use the attribution technique. Here, you can still do some isolation, but you need to rely solely on estimates. First, ask participants how much they’ve improved a specific business metric over the past months “…because of the training.” Second, you’ll take that very rough estimate of their performance improvement (which is typically inflated) and adjust it down for error and increased confidence.
To adjust the original estimate down, you’ll multiply it by the percentage of participants who had significant behavior change at Level 3 because of the training. The logic and math behind this is that if any participant didn’t apply the training and improved their behaviors on the job at Level 3, then we can’t be confident in their performance increase estimates at Level 4, so we assign them a 0% estimated increase at Level 4 and in that way drastically reduce any false inflation of business impact.
This technique was recently used at a health care insurance company to test the effects of a manager training program. Here, the original estimate of performance increase was 31%. We then went back to the data to see how much of our sample had high application at Level 3 (reported significant or exceptional improvement in the key trained behaviors back on the job), which was 29% of the sample. We then multiplied the original 31% estimate by 29% and calculated an isolated benefit of 9% directly due to training. When we monetized and annualized this 9% increase in performance, we ended with an ROI of 122%.
Go For It!
No matter what technique you choose, you will be happy to know that only 5 to 10% of all organizations in the world ever attempt to measure up to Level 4 business impact. And even fewer add the more rigorous but necessary step of isolation. The vast majority of organizations are heavy on their Level 1s, create a few Level 2s for their compliance training and, with great trepidation, try a Level 3. So, is it any wonder why business leaders and stakeholders still quietly and cautiously question the bottom-line value of training?
Whether you’re a trainer, a training developer or a training vendor, we’ll all be able to hold our heads a little bit higher when the CEOs, business leaders and stakeholders finally understand and appreciate the true value training brings to any organization. And the only way to really convince them that training actually caused a positive business outcome is to stack up the data and the evidence. In the end, we need to stop timidly saying, “We think our training helped,” and start confidently shouting, “Our training did that!”