You have a limited budget, and your learners have limited time for training. How can you achieve the biggest bang from your learning and development (L&D) buck? Using data analytics can help. By combining a high-performer job task analysis with a quantitative gap analysis, you can collect solid evidence of performance needs, enabling you to prioritize — and defend — your performance improvement efforts and create targeted, learner-centric solutions.
Targeting the Job Task Analysis
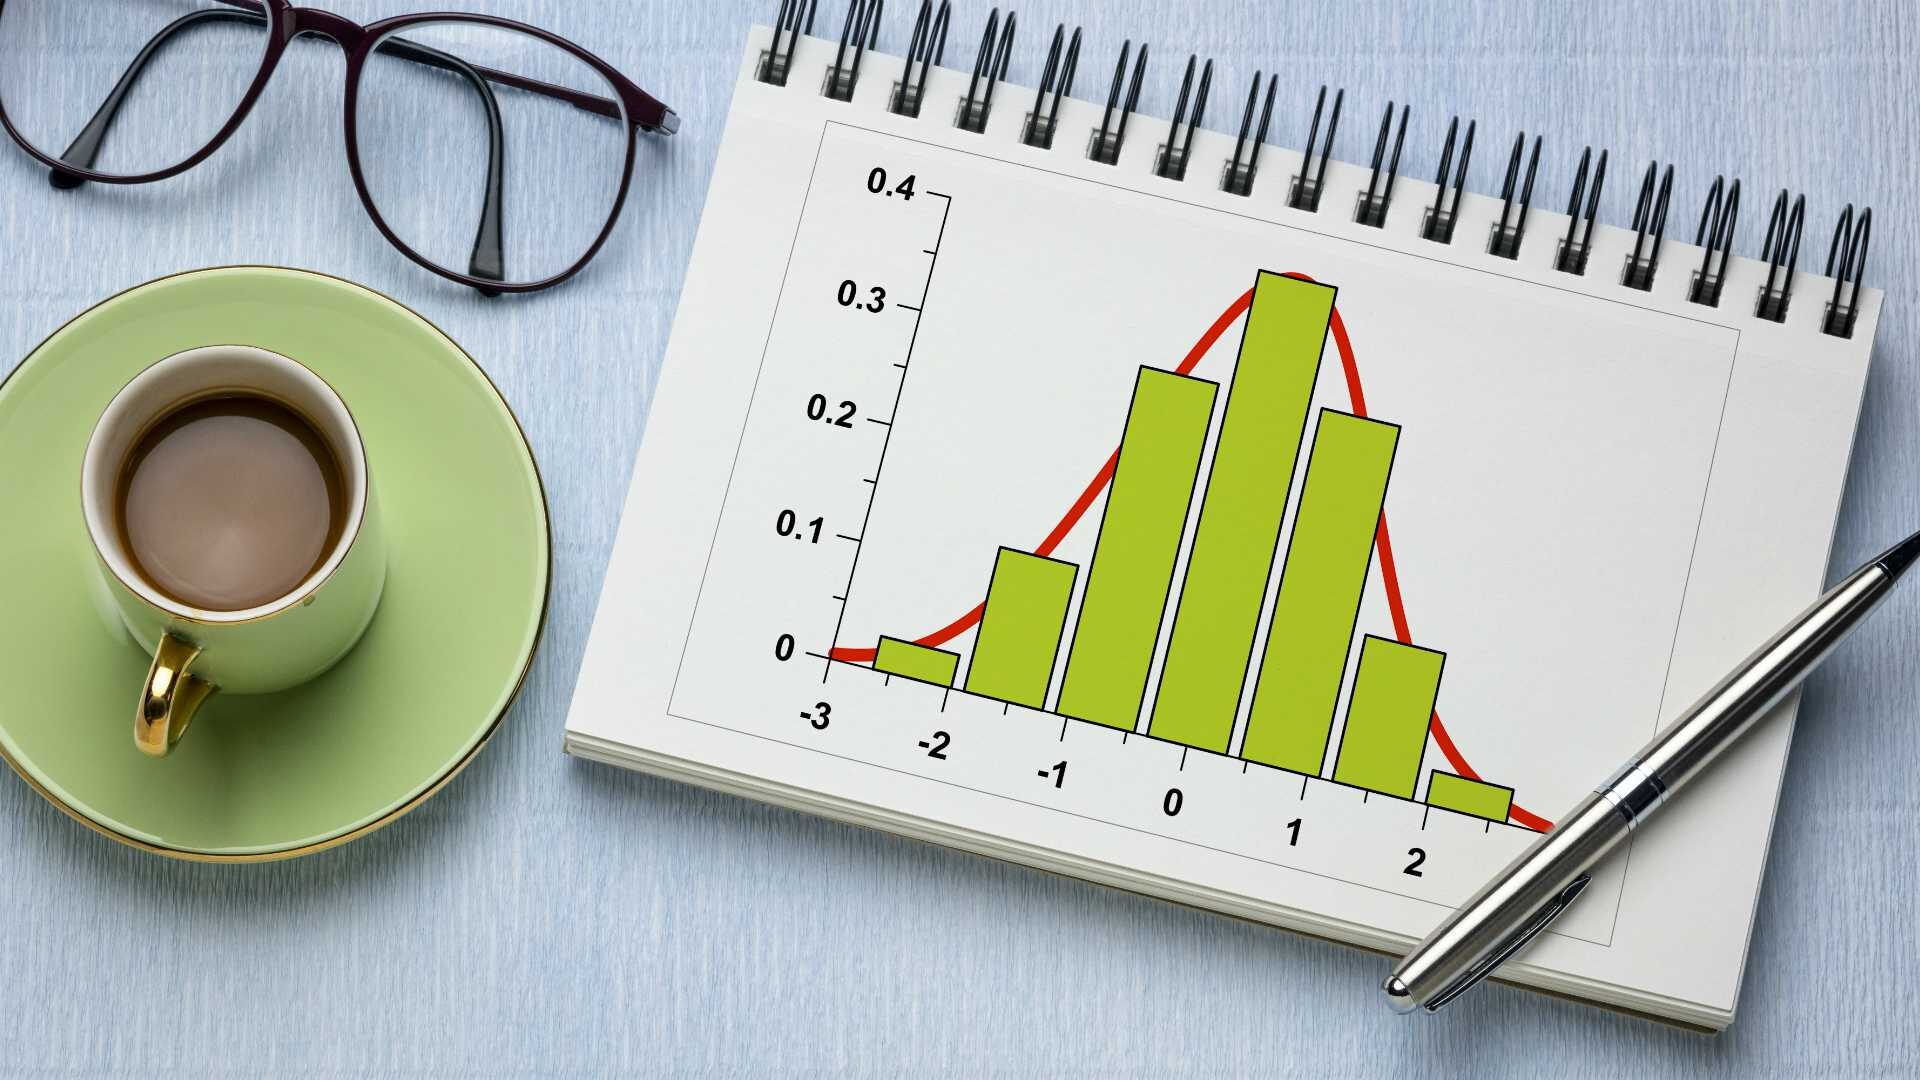
Many organizations target high performers — and the activities and behaviors that help them excel — for their job task analyses. They have good reason: to learn from the best and improve (upskill) the rest. Remember the bell-shaped curve from grade school, where you have the top students in the right tail and the struggling students in the left, with the rest of us somewhere in the middle?
Figure 1: Bell Curve

The same bell-shaped distribution rings true in work settings: High performers deliver exceptional results, while most employees do “OK” but could probably do better. What if we could shift the curve slightly to the right and make those average performers a bit better? Imagine the impact it could have on productivity and profits.
Figure 2: Shifting the Curve

A task analysis that captures a deep understanding of what your high performers do that sets them apart is a tremendous tool for any L&D team. A rigorous analysis can unpack the unconscious competence of these performers to identify knowledge, skills and behaviors that employees can teach and learn. It also highlights those characteristics innate to the individual that should become part of a hiring profile.
Written as performance statements, the job task analysis not only creates your learning objectives, but it also becomes the basis for your quantitative gap analysis. Below is an example of a few statements from a hypothetical job task analysis for a hotel guest service agent job.
Figure 3: Sample Performance Statements for Hotel Guest Service Agent

Assessing the Gaps
With the task analysis in hand, you are ready to conduct your gap analysis survey with all employees in the targeted job role. Ideally, you want to survey the managers, too; it’s important to learn whether performers and managers view the state of performance differently (they often do)!
Using a scale of 1 to 5, ask respondents to consider each of the performance statements and rate the importance of the statement and his or her own level of proficiency at executing the task. Managers should also rate the importance; think about a low, an average and a high performer on their team; and provide a proficiency rating for each.
Analyzing the Results
After the survey responses are in, the fun begins. The analysis compares importance and proficiency ratings and then computes the performance gaps (i.e., the difference between importance and proficiency). If you can include individual performance data (e.g., sales volume and customer satisfaction ratings) in your analysis, you can further segment the results into high, average and low performer categories.
Importance Ratings
Imagine that 85% of performers rate a task as very important to the job role. If managers rate the task similarly, there is agreement about its importance. On the other hand, if managers rate it lower, then there is a disconnect. Similarly, if high performers think something is important, but lower performers do not, you now have an important insight into the different mindsets of the two groups.
Proficiency Ratings
Often, managers and employees view levels of proficiency differently. Disagreement may suggest a lack of clear understanding of the task, either by the managers or by the employees. An interesting, yet common, finding is that high performers tend to be harder on themselves, highlighting areas where they want to continue to grow.
Performance Gaps
Compute gaps by comparing importance to proficiency. For example, if 85% of respondents rate a task as important and 35% rate themselves as proficient, the gap is 50 points.
Often, there are tasks that all performers view as important but at which only high performers consider themselves proficient. This disparity would suggest a training need — but only for the low and average performers.
When gaps are small, the need for training solutions is minimal. Importance and proficiency could both be high (e.g., 85% importance – 80% proficient = 5-point gap). Alternatively, both ratings could be low. An importance rating of 40% and proficiency of 50% actually results in a negative 10-point gap. Move on, and find other areas for improvement!
A great way to visualize the gap analysis data and facilitate decision-making is to display the data as a heat map. This method helps you quickly identify where the gaps are (red) and who has them. It also tells you when there is no gap (green).
Figure 4: Heat Map for Hotel Guest Service Agent

Consider two tasks from the hypothetical example for the hotel guest service agent job role:
1.4 “Respond to emergency situations following safety procedures with speed and efficiency.”
The gap ratings nearly jump off the page; this item has a literal red flag, especially for average and low performers. You can also quickly see that managers generally agree there’s a gap (importance – proficiency = 72 points for managers of low performers).
4.3 “Explain the parking policy.”
This gap does not exist for anyone (importance – proficiency = 0), so if you had limited budget and time, you would prioritize safety training over parking policy training. You may want to dig deeper on the safety issue to uncover the root cause to be sure training will help close the gap.
Prioritizing the Solutions
With your gap analysis and heat map in hand, you now have quantitative evidence of the biggest performance gaps, and you can make informed decisions about how to prioritize and defend your curriculum development plan. After all, it is founded in data that comes right from the learners.
Closing the Gap and Shifting the Curve
Using a data analytics approach like this one sets up your organization to truly learner-centric — offering training to close performance gaps identified by the learners themselves. The data-driven gap analysis provides an additional benefit: Now that you’ve identified and quantified the gaps, you’ll be able to measure any changes in performance and shift the curve.